

Currently Empty: USD$0.00
Uncategorized
Exploratory Data Analysis: The Complete Guide to Understanding Data Before Machine Learning
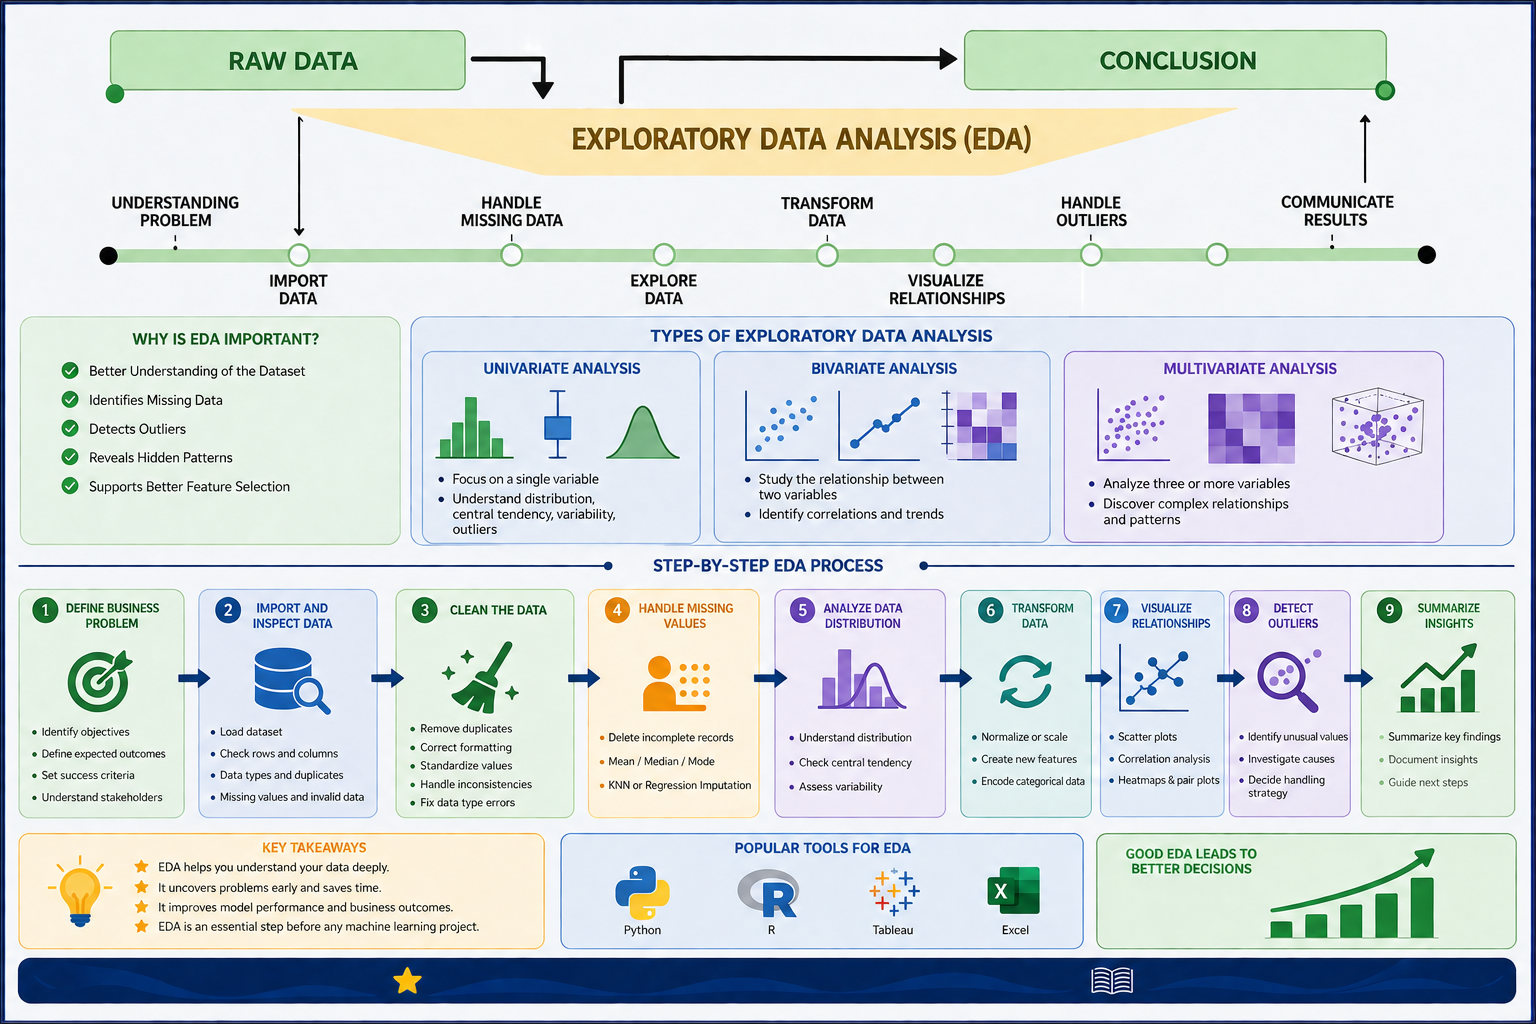
Exploratory Data Analysis (EDA) is the foundation of every successful data science and machine learning project. Before building predictive models or generating business insights, analysts need to understand the dataset they are working with. This is where Exploratory Data Analysis comes into play.
EDA is the process of examining, cleaning, summarizing, and visualizing datasets to uncover patterns, detect anomalies, identify relationships, and validate assumptions. Rather than jumping directly into modeling, data professionals use EDA to ensure the data is reliable, meaningful, and suitable for further analysis.
Whether you’re a beginner learning data analytics or an experienced data scientist working on complex machine learning models, mastering EDA will significantly improve the quality and accuracy of your results.
What is Exploratory Data Analysis (EDA)?
Exploratory Data Analysis (EDA) is a systematic approach to investigating datasets using statistical summaries and visualizations. Its primary purpose is to understand the characteristics of data before applying predictive analytics or machine learning algorithms.
Instead of making assumptions about the dataset, EDA allows analysts to ask questions like:
- What does the data look like?
- Are there missing values?
- Which variables influence each other?
- Are there unusual observations?
- Is the dataset balanced?
- Which features are most important?
By answering these questions early, organizations reduce the risk of poor model performance and incorrect business decisions.
Why is Exploratory Data Analysis Important?
Many machine learning failures occur because of poor-quality data rather than poor algorithms. Exploratory Data Analysis helps uncover these issues before they become costly problems.
Some major benefits include:
Better Understanding of the Dataset
EDA provides a complete overview of the dataset, including:
- Number of observations
- Number of variables
- Data types
- Feature distributions
- Category frequencies
This creates a solid foundation for future analysis.
Identifies Missing Data
Real-world datasets almost always contain incomplete information.
EDA helps identify:
- Missing values
- Null records
- Empty fields
- Inconsistent entries
Handling these issues properly improves model reliability.
Detects Outliers
Outliers are observations that differ significantly from the rest of the data.
For example:
- Extremely high salaries
- Unusual medical readings
- Suspicious financial transactions
Detecting these values helps determine whether they represent genuine events or data errors.
Reveals Hidden Patterns
EDA uncovers valuable relationships that might otherwise remain unnoticed.
Examples include:
- Customer purchasing behavior
- Seasonal sales trends
- Product demand cycles
- Disease progression patterns
These insights often drive business strategy.
Supports Better Feature Selection
EDA helps identify:
- Highly correlated variables
- Redundant features
- Irrelevant columns
- Important predictors
This leads to simpler, faster, and more accurate machine learning models.
Types of Exploratory Data Analysis
Depending on the number of variables being analyzed, EDA is divided into three major categories.
1. Univariate Analysis
Univariate analysis focuses on examining a single variable independently.
Its purpose is to understand:
- Distribution
- Central tendency
- Variability
- Outliers
Common visualization techniques include:
- Histograms
- Box plots
- Density plots
- Bar charts
- Frequency tables
Example:
Analyzing customer ages to understand the average age of buyers.
2. Bivariate Analysis
Bivariate analysis studies the relationship between two variables.
It answers questions like:
- Does income affect spending?
- Does study time improve exam scores?
- Does advertising increase sales?
Popular techniques include:
- Scatter plots
- Correlation analysis
- Covariance
- Cross-tabulation
- Line charts
Example:
Comparing advertising expenditure with monthly sales.
3. Multivariate Analysis
Multivariate analysis examines three or more variables simultaneously.
This helps discover complex relationships that cannot be observed through individual variables.
Popular methods include:
- Pair plots
- Correlation matrices
- Heatmaps
- Principal Component Analysis (PCA)
- Cluster visualization
Example:
Studying how age, income, education, and location together influence purchasing decisions.
Step-by-Step Exploratory Data Analysis Process
A structured EDA workflow ensures that no important aspect of the dataset is overlooked.
Step 1: Define the Business Problem
Before analyzing data, clearly identify:
- Business objectives
- Expected outcomes
- Success criteria
- Stakeholder requirements
Understanding the problem guides the entire analysis process.
Step 2: Import and Inspect the Dataset
Load the dataset using tools like Python or R and perform an initial inspection.
Key checks include:
- Number of rows and columns
- Data types
- Duplicate records
- Missing values
- Invalid entries
This provides a quick overview of data quality.
Step 3: Clean the Data
Data cleaning is essential before meaningful analysis can begin.
Typical tasks include:
- Removing duplicates
- Correcting formatting issues
- Standardizing values
- Handling inconsistent records
- Fixing data type errors
Clean data leads to more accurate insights.
Step 4: Handle Missing Values
Missing values can significantly affect statistical analysis and machine learning performance.
Common approaches include:
- Deleting incomplete records
- Mean imputation
- Median imputation
- Mode replacement
- K-Nearest Neighbors (KNN) imputation
- Regression-based imputation
The chosen method depends on the nature of the dataset and the extent of missing information.
Step 5: Analyze Data Distribution
Understanding how data is distributed helps determine the appropriate analytical methods.
Key statistical measures include:
- Mean
- Median
- Mode
- Variance
- Standard deviation
- Skewness
- Kurtosis
These metrics describe the center, spread, and shape of the data.
Step 6: Transform the Data
Data transformation prepares variables for advanced analysis.
Common transformations include:
- Feature scaling
- Normalization
- Standardization
- Log transformations
- One-hot encoding
- Label encoding
- Feature engineering
These techniques improve model performance and interpretability.
Step 7: Visualize the Data
Visualization makes patterns easier to understand than raw numbers alone.
Frequently used charts include:
| Visualization | Purpose |
| Histogram | Data distribution |
| Box Plot | Outlier detection |
| Scatter Plot | Relationship between variables |
| Bar Chart | Category comparison |
| Heatmap | Correlation analysis |
| Pair Plot | Multiple variable relationships |
| Line Chart | Trend analysis |
Visual analytics often reveal insights that statistical summaries may miss.
Step 8: Identify and Handle Outliers
Outliers can distort statistical results and negatively impact predictive models.
Common detection techniques include:
- Interquartile Range (IQR)
- Z-Score
- Box plots
- Isolation Forest
- DBSCAN
Before removing outliers, determine whether they represent genuine observations or data errors.
Step 9: Summarize Insights
The final stage of EDA is communicating findings clearly.
A comprehensive summary should include:
- Major trends
- Important correlations
- Missing data observations
- Outlier analysis
- Feature recommendations
- Business implications
Clear reporting helps stakeholders make informed decisions.
Popular EDA Techniques
Data professionals combine statistical methods with visualization to gain deeper insights.
Some of the most widely used EDA techniques include:
- Summary statistics
- Correlation analysis
- Frequency distribution
- Heatmaps
- Histograms
- Scatter plots
- Pair plots
- Box plots
- Density plots
- Principal Component Analysis (PCA)
- Clustering analysis
- Cross-tabulation
- Time-series visualization
Each technique serves a specific purpose depending on the dataset and business objective.
Best Tools for Exploratory Data Analysis
Several programming languages and software platforms simplify EDA.
Python
Python is the most popular language for EDA because of its rich ecosystem.
Popular libraries include:
- Pandas
- NumPy
- Matplotlib
- Seaborn
- Plotly
- Scikit-learn
R
R remains a preferred choice among statisticians.
Common packages include:
- ggplot2
- dplyr
- tidyr
- data.table
- caret
Business Intelligence Tools
Organizations also perform EDA using visual analytics platforms such as:
- Tableau
- Microsoft Power BI
- Qlik Sense
- Looker Studio
These tools enable interactive dashboards and real-time exploration.
Real-World Applications of Exploratory Data Analysis
EDA plays a vital role across industries by transforming raw data into actionable insights.
Common applications include:
- Customer segmentation and marketing analytics
- Fraud detection in banking and finance
- Credit risk assessment
- Healthcare diagnostics and disease prediction
- Manufacturing quality control
- Retail demand forecasting
- Supply chain optimization
- Recommendation systems for e-commerce and streaming platforms
- Human resource analytics
- Social media sentiment analysis
Best Practices for Effective Exploratory Data Analysis
To maximize the value of EDA:
- Clearly define your analytical objectives before exploring the data.
- Validate data quality by checking for missing values, duplicates, and inconsistencies.
- Use descriptive statistics alongside visualizations for a complete understanding.
- Investigate outliers carefully before deciding to remove or transform them.
- Document every transformation to maintain reproducibility.
- Leverage domain knowledge to interpret patterns accurately.
- Focus on actionable insights that align with business goals.
Common Mistakes to Avoid During EDA
Avoid these pitfalls to ensure reliable analysis:
- Skipping data cleaning and preprocessing.
- Ignoring missing values or assuming they are random.
- Removing outliers without understanding their cause.
- Misinterpreting correlation as causation.
- Overlooking feature distributions and skewness.
- Relying on a single visualization instead of multiple complementary charts.
- Failing to document findings and assumptions.
Frequently Asked Questions (FAQs)
What is Exploratory Data Analysis (EDA)?
Exploratory Data Analysis is the process of examining, summarizing, and visualizing data to understand its structure, quality, and relationships before applying statistical or machine learning models.
Why is EDA important in machine learning?
EDA improves model accuracy by identifying missing values, outliers, feature relationships, and data quality issues before model training.
What are the main types of EDA?
The three primary types are Univariate Analysis, Bivariate Analysis, and Multivariate Analysis, each focusing on different levels of variable interaction.
Which tools are commonly used for EDA?
Popular tools include Python (Pandas, NumPy, Matplotlib, Seaborn, Plotly), R (ggplot2, dplyr), Tableau, Microsoft Power BI, and Looker Studio.
What is the difference between EDA and data visualization?
Data visualization is one component of EDA. Exploratory Data Analysis encompasses data cleaning, statistical summaries, feature analysis, missing value treatment, outlier detection, and visualization to gain a comprehensive understanding of the dataset.
Conclusion
Exploratory Data Analysis is far more than a preliminary step—it’s the backbone of effective data science. By thoroughly examining datasets through statistical techniques, visualization, and data quality assessment, EDA helps uncover hidden patterns, validate assumptions, and prepare reliable data for advanced analytics and machine learning.
Whether you’re predicting customer behavior, detecting fraud, improving healthcare outcomes, or optimizing business operations, investing time in a structured EDA process leads to better decisions, more accurate models, and stronger business outcomes. Mastering EDA equips analysts and data scientists with the confidence to transform raw data into meaningful insights and create a solid foundation for every data-driven project.