SQL for Product & Growth Analytics
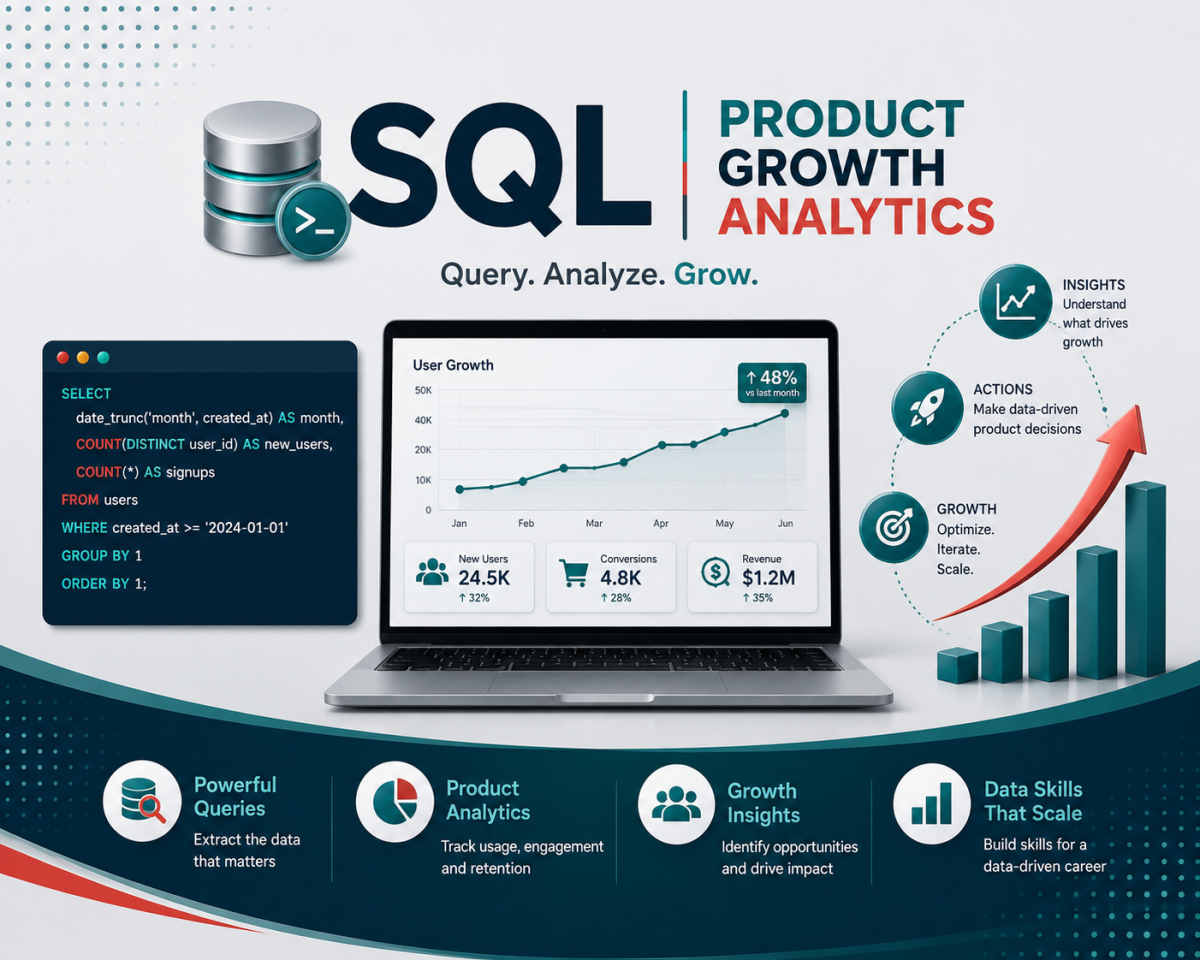
Use SQL to understand how users behave, where they convert, why they return, and what drives product growth.
3 course parts · 9-table product-growth database · 3 capstone projects · AI Tutor · Certificate issued by CiAI.
Self-paced online · Suitable for beginners learning SQL in a business and product analytics context.
Follow the Full User Journey
Connect acquisition, sessions, events, conversions and payments to understand how user behavior becomes business value.
Analyze Retention, Funnels & Cohorts
Use SQL to examine returning users, drop-offs, conversion steps, lifecycle groups and engagement patterns.
Evaluate Growth & Experiments
Measure revenue, user growth, A/B test performance and product outcomes to support better product decisions.
3 Applied Capstone Projects
Complete one capstone after each course part, progressing from product data foundations to growth decision support.
Turn Product Activity into Growth Insight with SQL
Digital products generate data every time a user signs up, starts a session, performs an action, purchases a product, makes a payment or enters an experiment. This course teaches learners how those records connect so they can analyze behavior, engagement, retention, conversion, monetization and growth.
What questions will you learn to answer?
You will use SQL to investigate practical product and growth questions such as: Where do users come from? Which features do they use? Which users return? Where do people drop out of the funnel? Which cohorts are more engaged? Which users generate revenue? Which experiment variant performs better?
What you will learn
- Understand user-, session-, event- and transaction-level product data
- Connect users, sessions, events, orders and payments through shared identifiers
- Analyze acquisition channels, traffic sources and product activity
- Measure engagement through sessions, events and feature usage
- Identify returning users and basic retention patterns
- Build funnels and identify conversion drop-offs
- Group users into cohorts and compare behavior over time
- Analyze customer journeys and event sequences
- Evaluate A/B tests and experiment variants
- Segment users by plan, channel, device, country or status
- Track user, session and revenue trends
- Analyze monetization, order value and payment behavior
- Turn product metrics into decision-ready growth reporting
Who this course is for
- Product managers and product professionals
- Growth analysts and growth professionals
- Product analysts and aspiring product analysts
- Digital and SaaS business professionals
- Marketing professionals working with acquisition and conversion data
- Beginners who want to learn SQL through product and growth use cases
SQL for Product & Growth Analytics: 3-Part Curriculum
The curriculum follows the uploaded course materials: product analytics foundations, user behavior and growth analysis, then advanced growth insights and decision-making.
Understand how product data is structured and how user activity flows from signup through sessions, events and transactions.
- Understanding product data and tables
- Exploring user activity and events
- Sessions and user interaction tracking
- Basic aggregations for product metrics
- Identifying new vs. returning users
- Data cleaning and preparing product data
- Understand user-level vs. session-level vs. event-level vs. transaction-level data
- Connect users → sessions → events → orders → payments
- Capstone 1: Product Data & Engagement Foundations Report
Move from basic querying into the analyses product and growth teams use to understand user behavior and conversion.
- User retention analysis
- Funnel analysis and conversion tracking
- Cohort analysis for user groups
- Feature usage and engagement analysis
- Customer journey and path analysis
- A/B testing and experiment analysis
- Use joins, GROUP BY, HAVING and ordered event data to study user behavior
- Capstone 2: Retention, Funnel & Experiment Analysis
Turn product behavior and transaction data into growth metrics, monetization insight and decision support.
- User segmentation and lifecycle analysis
- Growth metrics and trend analysis
- Conversion optimization and funnel diagnostics
- Revenue and monetization analysis
- Experiment evaluation and performance insights
- Business reporting and product decision support
- Use SQL to compare segments, trends, conversions, revenue and experiment outcomes
- Capstone 3: Product Growth Decision Dashboard
Follow the Product Growth Analytics Workflow End to End
Example: count distinct users at each event step
Product teams need to see how many users reach each action before they can identify where users drop off.
The course then builds toward retention, cohorts, customer journeys, monetization, A/B testing and growth decision support.
3 Hands-On SQL Product & Growth Capstone Projects
The course includes exactly 3 capstone projects — one after each course part — so learners progress from understanding product data to analyzing user behavior and supporting growth decisions.
Product Data & Engagement Foundations Report
Map the product data journey from users to sessions, events, orders and payments, then summarize core activity and engagement metrics.
Skills: product data levels, SELECT, filtering, aggregation, connected identifiers.
Retention, Funnel & Experiment Analysis
Analyze returning users, funnel steps, cohorts, feature usage, customer journeys and A/B experiment outcomes to identify behavior and conversion patterns.
Skills: GROUP BY, HAVING, joins, cohorts, funnels, ordered events, experiment comparison.
Product Growth Decision Dashboard
Create a decision-ready SQL report covering user segments, lifecycle status, growth trends, conversion performance, revenue, monetization and experiment results.
Skills: segmentation, trend analysis, conversion diagnostics, monetization and decision support.
Recommended Next SQL Courses
After completing SQL for Product & Growth Analytics, continue with deeper SQL and analytical courses that strengthen query logic, reporting and AI-assisted analysis.
SQL Intermediate
Strengthen analytical SQL with subqueries, CTEs, advanced filtering and data cleaning.
Explore SQL Intermediate →SQL Advance
Develop window functions, advanced set logic, performance and BI-ready SQL.
Explore SQL Advance →SQL Data Analytics
Expand into business intelligence, data engineering and machine-learning preparation.
Explore SQL Data Analytics →SQL AI-Assisted
Learn to generate, inspect, debug and verify SQL with AI while maintaining human judgment.
Explore SQL AI-Assisted →Course Details
Frequently Asked Questions
This course is designed for beginners and professionals who want to analyze user behavior, product performance and business growth with SQL.
The course includes exactly 3 capstone projects: 1) Product Data & Engagement Foundations Report, 2) Retention, Funnel & Experiment Analysis, and 3) Product Growth Decision Dashboard.
The certificate of completion is issued by the Canadian Institute of Artificial Intelligence (CiAI).
The working database contains 9 connected tables: users, products, sessions, events, orders, order_items, payments, experiments and experiment_results.
Part 1 covers product data and tables, user activity and events, session tracking, basic product metrics, new vs. returning users, data preparation, data levels and the user-to-payment data flow.
Part 2 covers retention, funnels, conversion tracking, cohorts, feature usage, engagement, customer journeys and A/B experiment analysis.
Part 3 covers segmentation, lifecycle analysis, growth trends, funnel diagnostics, revenue, monetization, experiment evaluation and product decision support.
Yes. Learners analyze returning users, activity over time and user groups based on shared characteristics or signup periods.
Yes. Learners use event and order data to count users at funnel stages, identify drop-offs and study conversion outcomes.
Yes. The experiments and experiment_results tables are used to compare variants, conversion outcomes and revenue generated.
Yes. Learners analyze orders and payments to calculate revenue, average order value, user-level revenue and payment patterns.
Recommended next courses include SQL Intermediate, SQL Advance, SQL Data Analytics and SQL AI-Assisted.
For current subscription, cancellation and refund information, visit the DataSoSi FAQ page or Contact Us.
Meet the Creator of the Course
Learn from an educator and machine learning engineer working across analytics, AI, data science and applied business problems.

Dr. Mark Lokanan
Professor · Senior Machine Learning Engineer · Data Scientist · AI Specialist
Dr. Mark Lokanan is a professor at Royal Roads University and a Senior Machine Learning Engineer at Vedia. His work spans data science, machine learning, artificial intelligence, analytics, financial crime, and applied research. Drawing on both academic and industry experience, he designed SQL for Product & Growth Analytics to help learners use SQL to understand user behavior, engagement, retention, funnels, monetization, experimentation and product-growth decision-making.