
Currently Empty: USD$0.00
Home » Python 1: Python for Data Analysis
Applied Python Course
Python 1: Python for Data Analysis
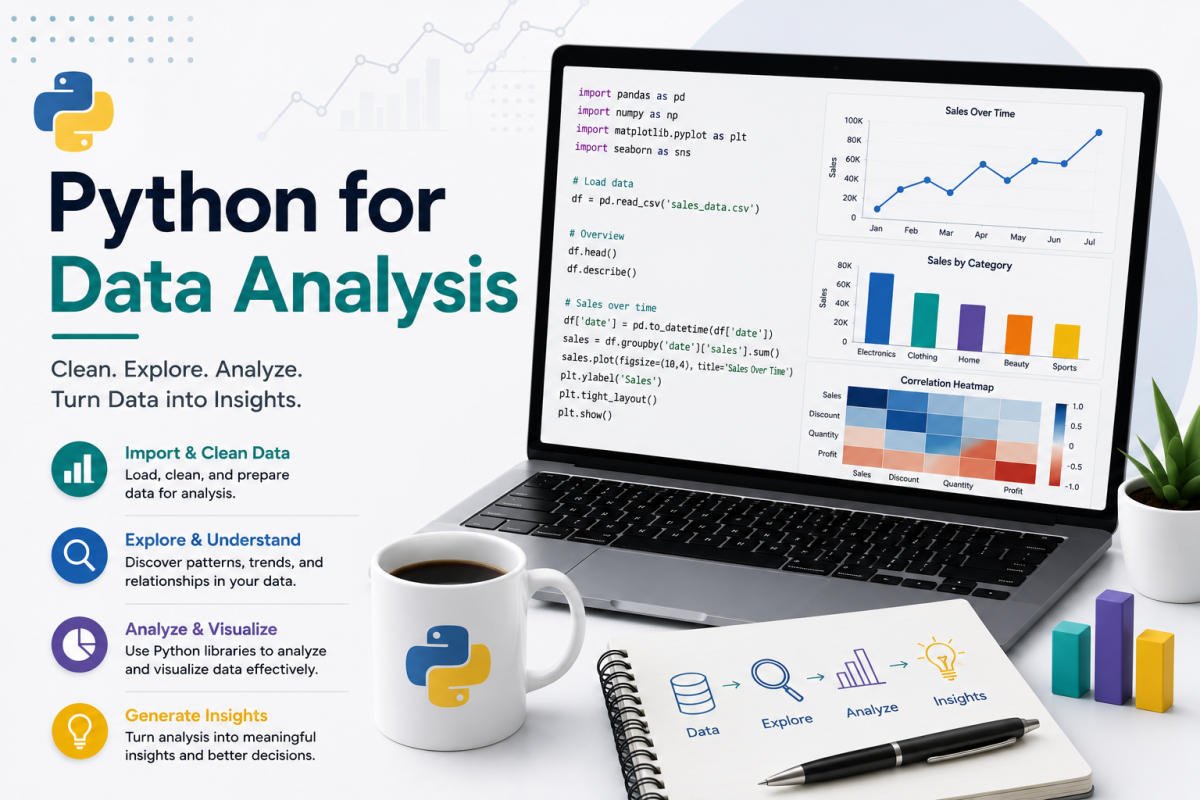
Learn Python by analyzing one realistic business dataset from start to finish. Build practical skills in loading, cleaning, transforming, combining and visualizing data through four individual NorthStar Retail projects and one final end-to-end capstone.
12 units · 4 individual projects · 1 final capstone · ~36 hours · AI Tutor · CiAI certificate
Original price was: USD$50.00.USD$15.99Current price is: USD$15.99. /month
Designed for practical learning: understand the concept, work with the code, inspect the output, and explain what the result means.
Learn the Workflow
Move from raw data to inspection, cleaning, transformation, visualization and interpretation in Jupyter.
Work with NorthStar Data
Use linked sales, customer and product data within one consistent retail analytics scenario.
Complete 4 Projects
Apply each major stage of the course in an individual hands-on NorthStar Retail project.
Finish with a Capstone
Bring the complete workflow together in a management-facing NorthStar analysis and documented notebook.
Learn Python for Data Analysis Through One Business Scenario
You join NorthStar Retail as a Junior Data Analyst. Across the course, you learn the company’s sales, customer and product data, then progressively use Python to inspect, clean, transform, combine, visualize and interpret that data.
Why one dataset across the course?
Instead of switching to unrelated datasets every time a new technique is introduced, the NorthStar scenario lets you see how separate Python skills connect inside a complete analytical workflow.
Core Python data skills
- Work with Jupyter Notebooks
- Use NumPy arrays and vectorized operations
- Analyze data with Pandas Series and DataFrames
- Identify and handle missing values
- Remove duplicates and correct data types
- Transform and aggregate data
- Join and combine multiple datasets
Analysis and communication skills
- Create charts with Matplotlib and Seaborn
- Analyze date and time variables
- Work with categorical and text data
- Work safely with numeric variables
- Create calculated metrics and ratios
- Write evidence-based interpretations
- Document an end-to-end analysis
Four Learning Phases
The 12 units progress from the foundations of working with data in Python to applied cleaning, visualization, advanced data types and a complete project.
Phase 1 · Units 1–3
Foundations
Jupyter, Python data structures, NumPy and the Pandas DataFrame workflow.
Phase 2 · Units 4–5
Data Work
Clean, transform, sort, group, aggregate and create new analytical variables.
Phase 3 · Units 6–7
Visualisation
Build charts with Matplotlib and Seaborn and connect visual choices to analytical questions.
Phase 4 · Units 8–12
Advanced + Capstone
Combine data, handle common data types and finish with a documented end-to-end analysis.
Python 1: Python for Data Analysis — 12-Unit Curriculum
The 12 units move from Python data foundations through NumPy, Pandas, cleaning, transformation and visualization into joining data, working with dates, text and numeric variables, and completing the final NorthStar Retail Analytics capstone.
Review Python in a data-analysis context and build a reliable Jupyter workflow.
- Python basics in a data context
- Jupyter cells, Markdown and workflow
- Data types and structures for analysis
- Read and write CSV, Excel and TXT files
Use NumPy arrays to perform efficient numeric operations.
- ndarray fundamentals
- Array operations and vectorization
- Mean, standard deviation, sum, min and max
- Reshaping, slicing and indexing
Move into the primary Python toolkit for structured data analysis.
- Series and DataFrames
- Load CSV and Excel data
- Use head(), info() and describe()
- Select columns and filter rows
Identify and correct common data-quality problems before analysis.
- Detect and handle missing values
- Remove duplicate records
- Rename columns and change data types
- Clean text with string operations
Reshape and summarize data so it can answer meaningful questions.
- Sort and rank data
- Group with groupby()
- Aggregate with agg()
- Use apply() and map()
- Create calculated columns
Build clear charts and multi-panel figures in Python.
- Line, bar, scatter and histogram plots
- Titles, labels and legends
- Subplots and multi-panel figures
- Save figures to image or PDF
Use statistical visualization to compare groups, distributions and relationships.
- Boxplots, heatmaps and pairplots
- histplot() and kdeplot()
- Use Seaborn with Pandas DataFrames
- Choose an appropriate chart for the data
Bring multiple datasets together without losing control of keys or duplicated fields.
- Stack DataFrames with pd.concat()
- Merge tables with pd.merge()
- Inner, left, right and outer joins
- Resolve duplicate keys and column conflicts
Convert, extract, filter and aggregate time-based data.
- Convert strings with pd.to_datetime()
- Extract year, month, day and weekday
- Filter and group by time period
- Analyze trends with resampling
Work effectively with categories, labels and text-based fields.
- Understand categorical variables
- Convert columns to category dtype
- Summarize category frequencies
- Use Pandas .str methods
Prepare and analyze numeric fields while creating useful derived measures.
- Integer and float data types
- Convert with pd.to_numeric()
- Mathematical operations and rounding
- Create metrics, ratios and derived columns
- Summarize numeric variables
Apply the complete Python data-analysis workflow to the NorthStar Retail Analytics dataset and present management-facing findings in a professional Jupyter Notebook.
- Load and explore the NorthStar sales, customer and product data
- Identify and resolve realistic data-quality issues
- Clean, transform and combine the related datasets
- Create and interpret Matplotlib and Seaborn visualizations
- Write specific, quantified findings and limitations
- Submit a documented notebook that runs cleanly from top to bottom
4 Individual NorthStar Projects + 1 Final Capstone
Every project uses the NorthStar Retail Analytics dataset. You work within one connected business scenario, so each project builds on the analytical skills and business context developed earlier in the course.
Project 1 · Foundations
Working with Data + NumPy
Begin as a Junior Data Analyst at NorthStar Retail and develop the computational foundation for the course.
- Work in Jupyter Notebooks
- Inspect NorthStar data structures
- Use NumPy arrays and vectorized operations
- Calculate and interpret numerical summaries
Project 2 · Data Work
Pandas, Cleaning + Transformation
Use Pandas to investigate NorthStar records, correct data-quality problems and create analysis-ready information.
- Load and explore DataFrames
- Identify missing, duplicate or inconsistent values
- Clean and standardize records
- Transform, group and create derived metrics
Project 3 · Visualization
Matplotlib + Seaborn Analysis
Turn NorthStar data into visual evidence that supports clear analytical conclusions.
- Create Matplotlib charts
- Build statistical visualizations with Seaborn
- Compare distributions, categories and relationships
- Interpret what each visualization means
Project 4 · Integration
Joining + Real-World Data Types
Combine the NorthStar sales, customer and product tables and work with the types of variables analysts encounter in practice.
- Join and combine related datasets
- Work with date and time variables
- Analyze categorical and text data
- Create and summarize numeric metrics
One connected dataset throughout the project sequence
NorthStar Retail Analytics includes transaction data, customer information, product details and a data dictionary. The scenario is designed around realistic data-quality issues so students practice not only writing Python code, but also checking, cleaning, verifying and interpreting the data before using it for decisions.
Final Capstone — NorthStar Retail Analytics
The fifth and final project brings the course together. You use the NorthStar Retail dataset as an integrated business-analysis problem and produce a management-facing Jupyter Notebook that demonstrates the complete Python data-analysis workflow.
Final Project · End-to-End NorthStar Analysis
Turn connected retail data into defensible business findings
Work across NorthStar’s sales, customer and product data. Explore the data, diagnose quality issues, clean and transform records, combine related tables, create analytical metrics and visualizations, and explain the resulting insights in plain language.
3 tablesSales · Customers · Products
151 sales rowsTransaction-level analysis
5+ chartsMatplotlib and Seaborn
1 notebookProfessional end-to-end submission
- Load and inspect the NorthStar Retail data
- Identify and resolve realistic data-quality issues
- Clean text, numeric, categorical and date variables
- Create new metrics and group-level summaries
- Join sales, customer and product information
- Create visual evidence with Matplotlib and Seaborn
- Write specific, quantified findings for management
- Submit a documented Jupyter Notebook that runs from top to bottom
Tools You Will Use
The course centers on a practical Python analytics stack rather than a long list of disconnected technologies.
PythonCore analysis language
JupyterNotebook workflow
NumPyNumeric arrays and operations
PandasStructured data analysis
Matplotlib + SeabornVisualization and interpretation
Who This Course Is For
The course is designed for learners who want to use Python as an applied data-analysis tool and prefer a structured path from concepts to practice.
Beginners in Python Data Analysis
Start with the data-analysis context and progress step by step through NumPy, Pandas and visualization.
Professionals & Analysts
Build practical skills for cleaning, transforming, analyzing and communicating data in a notebook workflow.
Students & Researchers
Develop a reproducible approach to exploring data, creating visual evidence and documenting findings.
Continue Your Python Data Science Path
After Python 1: Python for Data Analysis, continue in this sequence. Each course builds on the data-analysis foundation developed here and moves you toward machine learning.
Next 1
Data Cleaning and Wrangling
Develop deeper skills for cleaning, transforming and preparing real-world datasets for analysis.
Explore Data Cleaning and Wrangling →Next 2
Exploratory Data Analysis in Python
Explore distributions, patterns, relationships and anomalies before moving into predictive modeling.
Explore Exploratory Data Analysis in Python →Next 3
Data Splitting and Preprocessing
Prepare datasets for machine learning through train-test splitting, preprocessing and model-ready data preparation.
Explore Data Splitting and Preprocessing →Next 4
Building, Evaluating and Interpreting Models
Move into building machine learning models, evaluating performance and interpreting model results.
Explore Building, Evaluating and Interpreting Models →Python 1: Python for Data Analysis Course Details
PriceUS$15.99/month
Format100% online
Estimated duration~36 hours
Curriculum12 units
Individual projects4 NorthStar Retail projects
Final capstone1 end-to-end NorthStar Retail Analytics capstone
Core toolsPython, Jupyter, NumPy, Pandas
VisualizationMatplotlib and Seaborn
Dataset scenarioJunior Data Analyst at NorthStar Retail
Final deliverableDocumented Jupyter Notebook
AI TutorCourse-specific guidance
CertificateCanadian Institute of Artificial Intelligence (CiAI)
Frequently Asked Questions
You will learn the complete applied Python data-analysis workflow using Jupyter, NumPy, Pandas, cleaning, transformation, Matplotlib, Seaborn, joining datasets, date and time data, categorical and text data, and numeric analysis.
Yes. The course includes 4 individual projects + 1 final capstone. All five projects use the NorthStar Retail Analytics dataset.
NorthStar is the connected business dataset used throughout the projects. You work as a Junior Data Analyst with transaction, customer and product data and solve realistic data-quality and analysis problems.
The final capstone is an end-to-end NorthStar Retail analysis. You inspect, clean, transform and combine the data, create visualizations, interpret results, develop quantified findings, and submit a professionally documented Jupyter Notebook.
The course uses Jupyter Notebooks, NumPy, Pandas, Matplotlib and Seaborn.
The course is designed for approximately 36 hours of learning, including the four projects and final capstone.
The certificate of completion is issued by the Canadian Institute of Artificial Intelligence (CiAI).
Continue with Data Cleaning and Wrangling, then Exploratory Data Analysis in Python, then Data Splitting and Preprocessing, and then Building, Evaluating and Interpreting Models.
Meet the Creator of the Course
Learn from an interdisciplinary professor and applied AI researcher working across data science, machine learning, analytics, accounting and financial crime.

Dr. Mark Lokanan
Professor, Royal Roads University · Intellectual Lead, Accounting · Machine Learning & AI Researcher
Dr. Mark Lokanan is a Professor in the School of Business at Royal Roads University and Intellectual Lead, Accounting. His work spans data science, machine learning, artificial intelligence, fraud detection and financial crime. His teaching focuses on making coding, analytics and AI practical and accessible for learners who want to apply technical methods to real-world decisions.
Start Python 1: Python for Data Analysis
Learn the Python data-analysis workflow through four NorthStar projects, then bring everything together in the final end-to-end capstone.
Enroll in Python for Data AnalysisPython 1: Data Analysis Assistant
Ask me about the 12 units, 4 NorthStar projects, final capstone, tools, price, certificate, or next courses.