
Currently Empty: USD$0.00
Home » Python Courses » Data Skills with Python
Python Data Analysis · Applied · Project-Based
Data Skills with Python
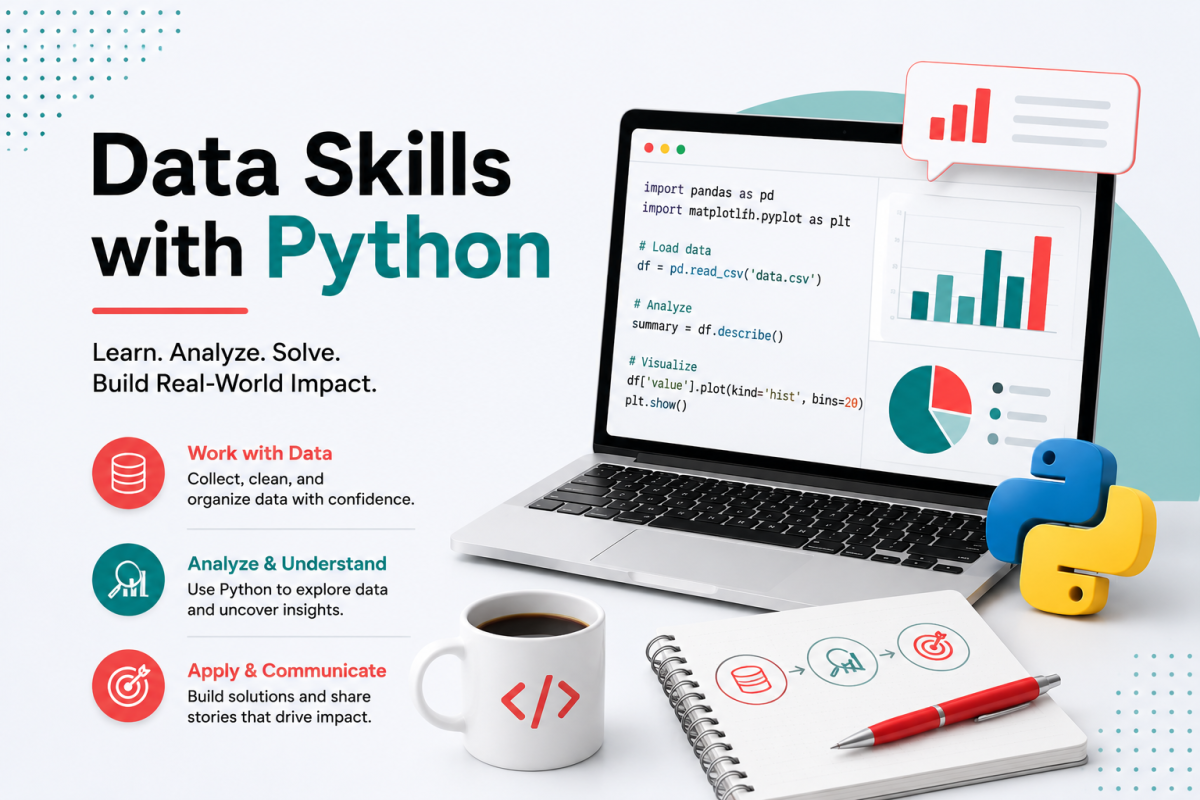
Move from writing Python code to using Python to understand data. Learn NumPy for fast numerical work, Pandas for real tables, data cleaning and analysis, and Matplotlib for charts—then bring the full workflow together in applied projects.
4 modules · 8 instructional units · 4 individual capstones · 1 final capstone · NumPy + Pandas + Matplotlib · AI Tutor · CiAI certificate
Original price was: USD$50.00.USD$15.99Current price is: USD$15.99. /month
Self-paced online learning. Basic Python variables, loops, functions, and lists are recommended before starting.
Applied learning · Real data workflow · Build, analyze, visualize and explain findings
Learn NumPy First
Work with arrays, vectorized math, slicing, indexing and simulations.
Move Into Pandas
Load, inspect, clean, sort, filter and group structured data.
Visualize the Findings
Create line, bar and scatter plots with Pandas and Matplotlib.
Explain What the Data Means
Finish analyses with plain-language conclusions instead of stopping at code or charts.
Learn the Complete Entry-Level Data Analysis Workflow
The course moves from numerical processing to structured data analysis. Students first learn how NumPy handles numbers efficiently, then use Pandas to work with real tables, clean messy values, explore patterns, summarize groups, create charts and communicate what they discovered.
The workflow students practice
Load or create data → clean it → explore it → sort and filter → group and summarize → visualize → explain the insight.
Numerical foundations
- NumPy arrays and 2D arrays
- Vectorized math without manual loops
- Indexing and slicing
- Summary statistics
- Random number generation
- Probability simulations
Real data analysis skills
- Pandas DataFrames
- Missing-value and duplicate handling
- Sorting and Boolean filtering
- Grouping and aggregation
- Matplotlib charts
- Plain-language data storytelling
Four Modules — From Numbers to Insights
Module 1
Foundations of Data Analysis with NumPy
Learn how computers store, organize and process numerical data efficiently.
Module 2
Working with Data and Simulations
Use randomness and probability, then move into Pandas DataFrames and structured data.
Module 3
Preparing and Analyzing Real Data
Clean messy data and use sorting, filtering and grouping to uncover useful patterns.
Module 4
Communicating Data Insights
Turn analysis into charts, explanations and an applied mini data project.
8-Unit Curriculum
Each unit is collapsible and connects a practical Python data skill to an applied scenario.
Create NumPy arrays, compare arrays with regular Python lists, perform element-wise math, calculate summary statistics, and work with 2D arrays.
Applied Practice: Player Scores & 2D Array ChallengesUse fast array calculations, slicing, indexing, comparisons, party-stat arrays and targeted updates to work with many values efficiently.
Applied Practice: Buffs, Slicing & Party StatsGenerate random numbers, simulate dice rolls and loot drops, use probability, and run repeated simulations to explore possible outcomes.
Applied Practice: Dice, Loot & Probability SimulationsCreate and explore Pandas DataFrames, select columns, filter rows, inspect data and calculate quick descriptive statistics.
Applied Practice: Become a Data DetectiveFix missing values, remove duplicates, rename columns and correct data types so the dataset is reliable enough to analyze.
Applied Practice: Clean a Messy DatasetSort rows, filter with one or more conditions, select specific columns, group by category and calculate summaries with aggregation.
Applied Practice: Explore and Compare GroupsCreate line charts, bar charts and scatter plots with Pandas and Matplotlib, then add titles, labels and styling so charts communicate clearly.
Applied Practice: Turn Data Into ChartsAnalyze a game-stats dataset from start to finish: clean it, find top players, group by team, calculate average damage, create a bar chart and write a short explanation of the findings.
Mini Project: Ultimate Player Analysis4 Individual Capstones — One for Each Module
Each module ends with one larger individual capstone. The capstones consolidate the skills from that module before students move to the separate final course capstone.
Apply NumPy arrays, element-wise math, indexing, slicing and summary statistics in one integrated numerical-analysis project.
Combine randomness and simulation thinking with structured Pandas DataFrames to explore data-driven scenarios.
Take messy tabular data through cleaning, sorting, filtering, grouping and aggregation to produce reliable analytical summaries.
Combine data exploration with visualization and plain-language interpretation so the analysis ends with a clear, evidence-based story.
1 Final Course Capstone
The final capstone is separate from the four individual module capstones and from the Unit 8 mini project. It brings the complete course workflow together.
Entire Course Integration
Complete a Full Data Analysis Workflow
Students bring together the full toolset developed across the course: numerical processing, structured data, cleaning, exploration, grouping, visualization and communication. The source materials do not specify a fixed final-capstone dataset, so the page does not invent one.
4modules integrated
8instructional units applied
4individual capstones completed first
1final end-to-end analysis
- Prepare or load a dataset
- Inspect structure and quality
- Handle missing or duplicate values
- Sort and filter relevant records
- Group data by meaningful categories
- Calculate summary statistics
- Create suitable charts
- Interpret patterns and comparisons
- Write a plain-language findings summary
- Identify a useful next question
Continue Your Python Data Path
After Data Skills with Python, students can continue into larger applied projects and then learn how to communicate analytical findings more effectively.
Next Course 1
Python Real-World Project
Apply Python skills in a more complete real-world project where learners work through a larger practical problem from start to finish.
Continue to Python Real-World Project →
Next Course 2
Data Storytelling
Learn how to turn analytical results into clear visuals, explanations and stories that help an audience understand what the data means.
Continue to Data Storytelling →Course Details
CourseData Skills with Python
LevelBeginner to Intermediate
Format100% self-paced, online
Modules4
Instructional units8
Individual capstones4 — one per module
Final capstone1 end-to-end data analysis
Core toolsPython · NumPy · Pandas · Matplotlib
Recommended prior skillsVariables · loops · functions · lists
AI TutorIncluded
CertificateCanadian Institute of Artificial Intelligence (CiAI)
Frequently Asked Questions
Students should already be comfortable with basic Python variables, loops, functions and lists. NumPy, Pandas, cleaning, grouping and visualization are introduced in the course.
The course contains 8 instructional units, 4 individual capstones—one for each module—and 1 separate final capstone.
The course uses NumPy for numerical work, Pandas for tabular data analysis and Matplotlib for visualization.
Unit 8 is a mini data project. Students work with a game-stats dataset, clean it, find top players, group by team, calculate average damage, create a bar chart and write a short explanation of the findings.
The final capstone is a separate end-to-end data analysis that brings together data preparation, cleaning, exploration, grouping, summary statistics, visualization and communication. The supplied course files do not specify one fixed final-capstone dataset.
Yes. Students receive guided explanations, hints, debugging support and help understanding Python code and analytical output.
The certificate of completion is issued by the Canadian Institute of Artificial Intelligence (CiAI).
Continue with Python Real-World Project, followed by Data Storytelling.
Meet the Creator of the Course
Learn from an experienced AI and machine-learning scholar who also builds applied technology solutions.

Dr. Mark Lokanan
Professor at Royal Roads University · Senior Machine Learning Engineer at Vedia · Senior Machine Learning & AI Scholar
Dr. Mark Lokanan is a Professor at Royal Roads University and Senior Machine Learning Engineer at Vedia. His work spans machine learning, artificial intelligence, data science, analytics and applied technology. His teaching focuses on making coding, data and AI practical and understandable through structured projects that show learners how individual pieces of code connect into complete systems.