
Currently Empty: USD$0.00
Home » Python Courses » Python Real-World Project
Practical Python · Real Data · Project-Based
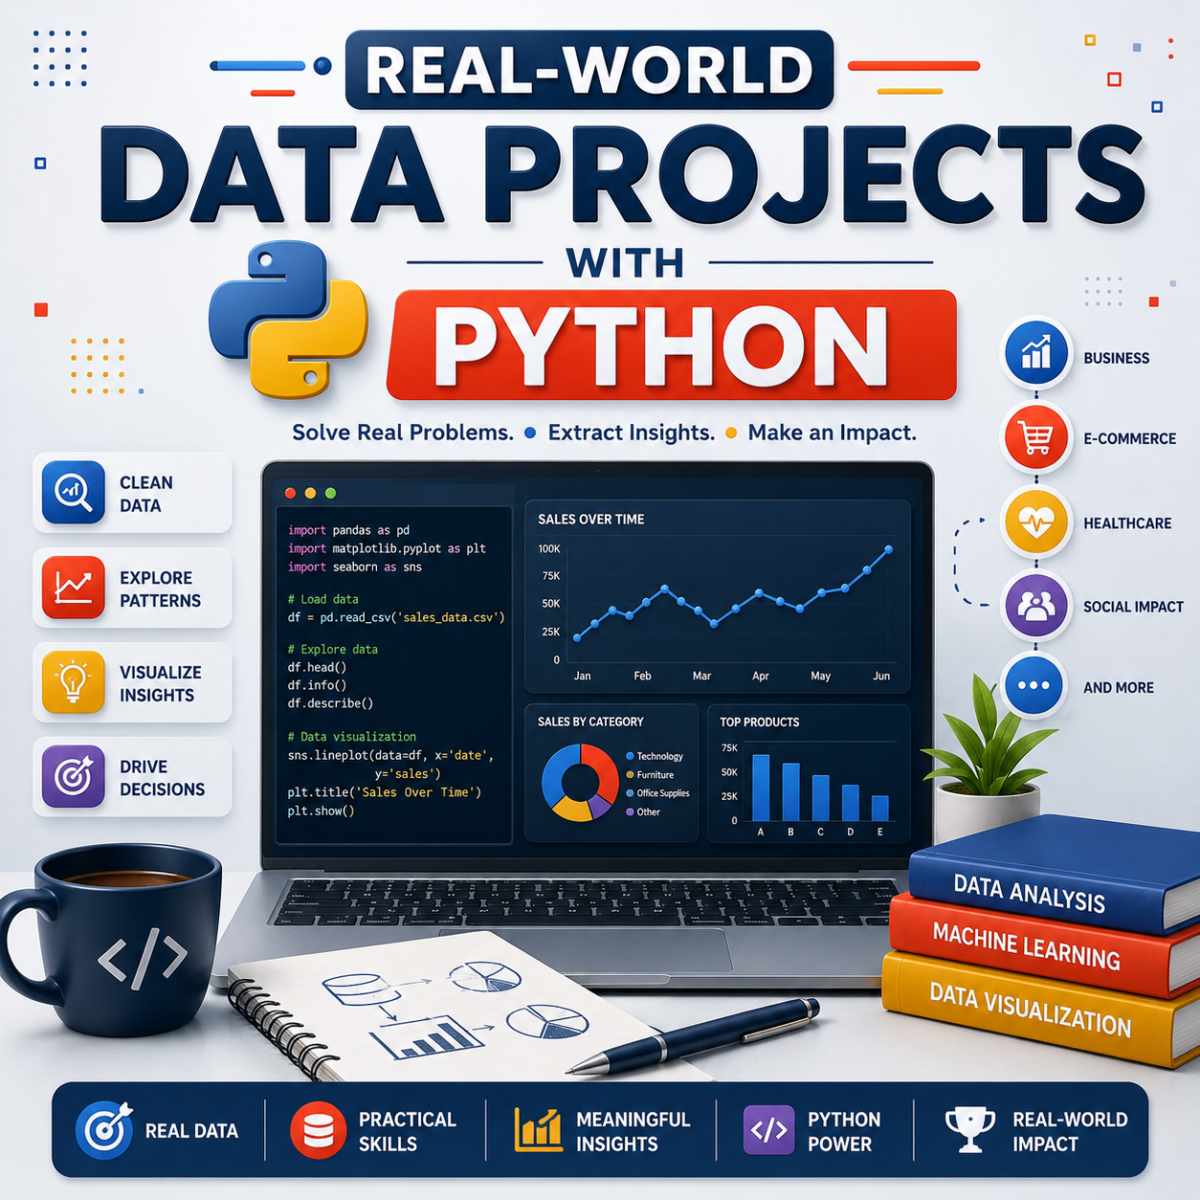
Python Real-World Project
Learn Python by solving problems that feel real. Track grades, spending, survey responses and personal data. Use Python to collect information, organize it, calculate useful results, identify patterns and explain what the data is telling you.
4 modules · 8 instructional units · 4 individual capstones · 1 final capstone · Real-world data projects · AI Tutor · CiAI certificate
Original price was: USD$50.00.USD$15.99Current price is: USD$15.99. /month
Self-paced online learning. The supplied course materials state that no prior Python experience is required.
Beginner-friendly · Real inputs · Practical analysis · Build programs that produce useful insights
Start With Everyday Data
Use grades, spending, survey answers, screen time, study time and other familiar examples.
Build Complete Programs
Move beyond isolated syntax into programs that collect, process and report useful information.
Find Real Insights
Calculate averages, totals, percentages, top values and most-popular responses.
Create Your Own Data Tool
Unit 8 gives students a framework for designing a data tool around a topic they choose.
Python for Real Life — Not Just Syntax Practice
Every unit connects Python to a question a learner could realistically ask: What was the class average? Where did my money go? Which survey answer was most popular? What was my highest gaming score? The course develops coding and data thinking together.
The project workflow
Collect data → store it → process it → calculate results → find patterns → print an insight worth knowing.
Python foundations used throughout
- Variables and user input
- Lists and list operations
- for and while loops
- if / elif / else
- Dictionaries and key-value pairs
- Nested dictionaries
Data-analysis thinking
- Totals and averages
- Highest and lowest values
- Pass/fail and category rules
- Percentages and budget comparisons
- Frequency tables and tallies
- Most-popular responses and conclusions
Four Modules — From Data Foundations to Decisions
Module 1
Foundations of Working with Data in Python
Learn how to organize, store and begin analyzing data using variables and lists.
Module 2
Data Processing and Organization
Use loops and dictionaries to automate analysis and structure information efficiently.
Module 3
Solving Real-World Problems with Python
Apply Python to practical grade and personal-budget analysis projects.
Module 4
Data Insights and Decision-Making
Analyze surveys, build a custom data tool and communicate useful findings.
8-Unit Curriculum
Expand each unit to see what students learn and what they build.
Learn what data is, store information in variables and lists, retrieve list items, and use print() and input() to interact with a program.
Mini Build: My Week TrackerUse list operations, sum(), len(), averages and .count() to summarize collections of values and analyze simple patterns.
Mini Build: Snack TrackerCombine loops with conditions to count matches, tally categories, compare values and find maxima or minima automatically.
Mini Build: Most Popular Item FinderStore labelled information with key-value pairs, look up and update values, loop through dictionaries and use nested dictionaries for structured records.
Mini Build: Student Info SystemCollect student names and grades, calculate the class average, identify the top student, count passes and fails, and classify performance with conditional logic.
Full Project: Class Grade AnalyzerTrack spending by category, calculate total spending, compare spending with income or budget, find the largest category and calculate percentages.
Full Project: Personal Budget TrackerCollect responses, normalize text, create frequency tables, calculate percentages, sort results and identify the most popular answer.
Full Project: Survey AnalyzerChoose a topic, plan what data to collect, decide which insights the program should discover, then build and test a complete Python data tool using lists, loops, dictionaries and analytical calculations.
Project Choices: Study · Sleep · Gaming · Social Media · Custom Survey4 Individual Capstones — One for Each Module
Each module includes one individual capstone. These four capstones are separate from the smaller unit builds and from the final course capstone that follows Unit 8.
Consolidate variables, lists, input/output, totals, counts and averages in one larger applied project.
Combine loops, conditions and dictionaries to process, organize and summarize structured information.
Apply the module's grade and budget-analysis techniques in a larger real-world problem-solving project.
Use survey-analysis and custom-tool skills to turn collected data into clear findings and useful decisions.
1 Separate Final Course Capstone
Your current course outline places the final capstone after the Unit 8 project. The supplied files do not provide a fixed title or dataset for that separate final capstone, so the SEO page preserves the structure without inventing details.
Entire Course Integration
Apply the Complete Real-World Data Workflow
The final capstone brings the complete course together. Students are expected to collect or organize data, process it with Python, calculate useful summaries, identify meaningful patterns and communicate what the results show.
4modules integrated
8instructional units completed
4individual capstones completed first
1separate final capstone
- Collect or organize meaningful data
- Use lists and dictionaries
- Process records with loops
- Apply conditional logic
- Calculate totals or averages
- Find high, low or popular values
- Calculate counts or percentages
- Produce at least two useful insights
- Explain what the results mean
- Test and refine the complete program
Continue Your Data Path
After building real-world Python projects, students can continue by strengthening how they communicate findings, then move into structured database analysis with SQL.
Next Course 1
Data Storytelling
Learn how to turn analytical results into clear visuals, explanations and stories that help an audience understand what the data means.
Continue to Data Storytelling →
Next Course 2
SQL Basics Overview
Move from Python projects into structured database querying and learn how SQL is used to retrieve, filter and summarize data.
Continue to SQL Basics Overview →Course Details
CoursePython Real-World Project
Alternate titleReal-World Data Projects with Python
LevelBeginner
Format100% self-paced, online
Modules4
Instructional units8
Individual capstones4 — one per module
Final capstone1 separate capstone after Unit 8
Core Python toolsVariables · lists · loops · conditions · dictionaries
AI TutorIncluded
CertificateCanadian Institute of Artificial Intelligence (CiAI)
Frequently Asked Questions
Yes. The supplied course overview states that no prior Python experience is required. Unit 1 starts with variables, lists, print() and input(), then the course builds toward larger data projects.
The current course structure contains 8 instructional units, 4 individual capstones—one per module—and 1 separate final capstone after Unit 8.
Students build a Class Grade Analyzer, Personal Budget Tracker, Survey Analyzer, and in Unit 8 create their own data tool around a topic such as study time, sleep, gaming, social media or a custom survey.
Unit 8 is Build Your Own Data Tool. Students choose a topic, decide what data to collect, plan at least two insights and build a complete program using lists, loops, dictionaries and calculations.
Your current module outline places a separate final capstone after Unit 8. The supplied files do not specify a fixed title or dataset for that final capstone, so the page does not invent one.
Yes. Students receive guided explanations, hints, debugging support and help understanding Python code and analytical output.
The certificate of completion is issued by the Canadian Institute of Artificial Intelligence (CiAI).
Continue with Data Storytelling, followed by SQL Basics Overview.
Meet the Creator of the Course
Learn from an experienced AI and machine-learning scholar who also builds applied technology solutions.

Dr. Mark Lokanan
Professor at Royal Roads University · Senior Machine Learning Engineer at Vedia · Senior Machine Learning & AI Scholar
Dr. Mark Lokanan is a Professor at Royal Roads University and Senior Machine Learning Engineer at Vedia. His work spans machine learning, artificial intelligence, data science, analytics and applied technology. His teaching focuses on making coding, data and AI practical and understandable through structured projects that show learners how individual pieces of code connect into complete systems.