

Currently Empty: USD$0.00
Home » Python Courses » Data Storytelling
Visual Thinking · Practical Python · Insight Communication
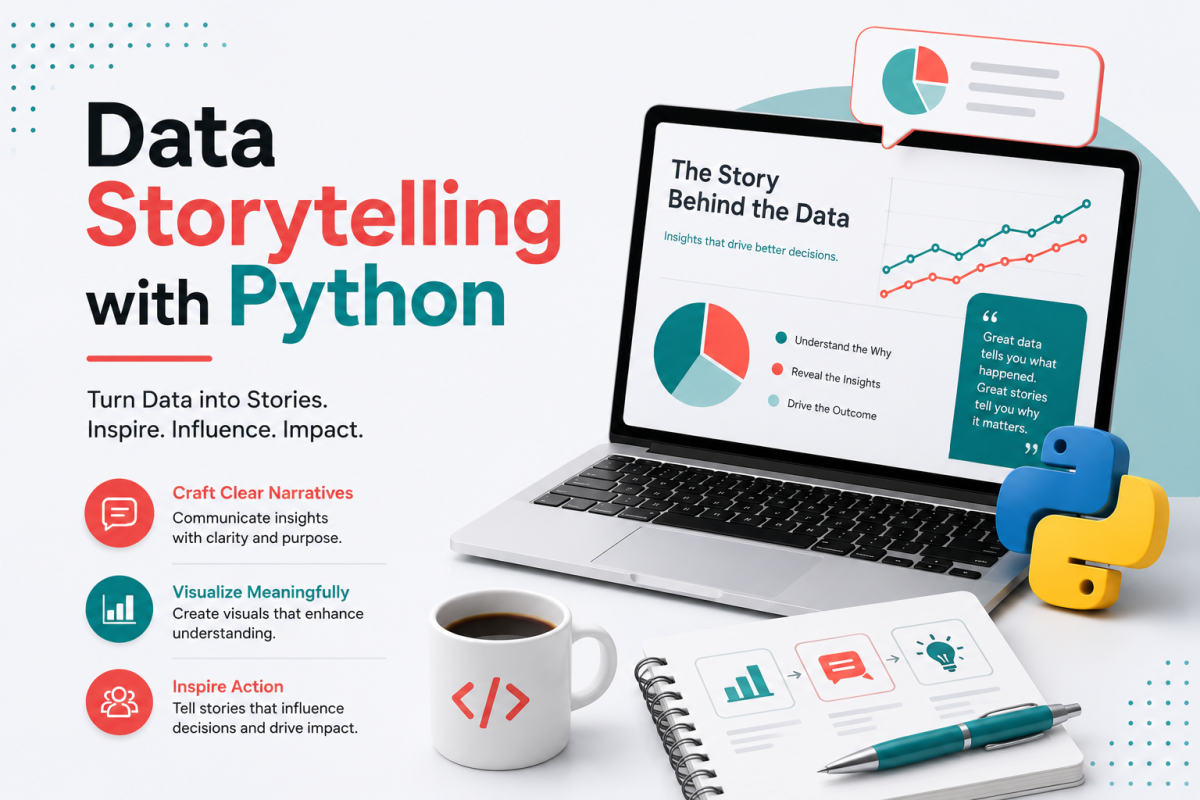
Data Storytelling with Python
Data is not just numbers - it is a story waiting to be told. Learn how to organize raw data, count what matters, compare results, identify patterns, explain what they mean, and communicate evidence-based insights in clear language.
4 modules · 9 units · 4 individual capstones · 1 final capstone · Python visual thinking · AI Tutor · CiAI certificate
Original price was: USD$50.00.USD$15.99Current price is: USD$15.99. /month
Self-paced online learning focused on thinking, explaining and communicating - not heavy analytical software.
Beginner-friendly · Plain-language analysis · Real-world topics · Evidence-based insights
See the Story in Raw Data
Learn the difference between a list of facts and useful information with meaning.
Visualize Without Heavy Tools
Build readable frequency tables and text-based bar charts directly in the notebook.
Move From Fact to Insight
Progress from reporting a number to explaining a pattern and why the pattern matters.
Communicate Honestly
Use evidence-based wording such as "suggests" or "appears linked" rather than claiming causation.
Learn to Think Like a Data Storyteller
The course deliberately keeps the tools simple so learners can focus on reasoning. Python lists, dictionaries, loops, totals, averages, percentages and text-based charts are used to uncover patterns and explain them clearly.
The storytelling workflow
Collect data → organize it → count and summarize → compare → find the pattern → explain why it matters → communicate the insight.
Analytical foundations
- Data versus information
- Lists, categories and dictionaries
- Frequency counting
- Totals and averages
- Highest and lowest values
- Percentages and rankings
Storytelling foundations
- Plain-language observations
- Text-based bar charts
- Side-by-side comparisons
- Fact → finding → insight
- Why-it-matters statements
- Evidence-based recommendations
Four Modules - From Raw Data to Clear Stories
Module 1
Foundations of Data Storytelling
Understand what a data story is and organize raw information so meaning starts to emerge.
Module 2
Exploring and Understanding Data
Count, compare, explain and analyze everyday datasets such as music preferences and screen time.
Module 3
Developing Insights
Compare variables, identify trends and move from simple findings to evidence-based insights.
Module 4
Communicating Data Stories
Plan, build and present a complete data story using a topic and data that learners care about.
9-Unit Curriculum
Each unit is collapsible. The first eight units are supported by the detailed course files; Unit 9 follows the current course structure supplied with this page.
Learn the difference between raw data and information, make simple observations, use .count() to measure frequency, and write plain-language explanations of what a dataset shows.
Applied Practice: Observe, Count and ExplainTurn messy lists into organized categories, build tally dictionaries, create simple text bar charts and add counts and percentages so the story becomes easier to see.
Applied Practice: Survey Grouping and Text Bar ChartsBuild frequency tables, count every category, calculate percentages, identify the most and least frequent responses, and compare gaps between categories.
Mini Project: Music Preferences - Part 1Move from numbers to meaning by ranking results, generating explanation sentences, comparing categories and using phrases such as "more than," "twice as many" and "close behind."
Mini Project: Music Preferences - Part 2Analyze daily habits by calculating total and average screen time, identifying the highest and lowest days, comparing days with the average and printing a daily text-based chart.
Project: Daily Screen Time AnalysisCompare two datasets side by side, flag days where conditions occur together, compare averages and write careful explanations that recognize relationships without claiming causation.
Mini Project: Sleep vs Screen TimeLearn the three levels of analysis - fact, finding and insight. Identify trends, compare groups, calculate gaps and turn evidence into a clear why-it-matters statement or recommendation.
Project: Sleep vs GradesChoose a topic, plan the data story before coding, organize data with at least one list and one dictionary, create a text-based chart, calculate a summary and write at least two strong insights.
Project Choices: Music Survey · Screen Time · Sleep + Performance · Custom TopicUse the full storytelling workflow to consolidate the course: organize real-world data, calculate meaningful summaries, create a visual representation, identify patterns and prepare a complete data story before the separate final capstone.
Capstone-Preparation Unit4 Individual Capstones - One for Each Module
Each module includes one individual capstone that consolidates the skills developed in that stage. These four individual capstones are separate from the final course capstone.
Organize a raw set of responses, count categories, build a simple visual representation and write a clear explanation of what the data shows.
Combine frequency analysis, comparisons, totals, averages and written explanations to turn an everyday dataset into a meaningful story.
Compare related variables, identify a pattern, evaluate the strength of the relationship and write an evidence-based insight explaining why the finding matters.
Plan and communicate a complete data story using a visual, one or more numerical summaries and clear language that explains the pattern without overstating the evidence.
1 Final Course Capstone
The final capstone brings together the complete course. Students select a topic that interests them, collect real-world data, organize it, analyze it and transform the findings into a clear data story.
Entire Course Integration
From Raw Data to Evidence-Based Insight
Students choose a topic, collect or work with real-world data, organize the data with Python structures such as lists and dictionaries, create a visual chart, calculate useful summaries and communicate what the findings suggest. The emphasis is on understanding and explaining the evidence, not producing a perfect polished product.
4modules integrated
9units brought together
2-3numbered insights expected
1complete data story
- Choose a meaningful topic
- Collect or organize real-world data
- Use at least one list
- Use at least one dictionary
- Create a labelled text-based bar chart
- Include a total, average or frequency summary
- Give the numerical result context
- Write 2-3 numbered insights
- Explain why each finding matters
- Use careful, evidence-based language
- Include comments in the Python code
- Be able to explain every line of code
Supported project directions: Music Preference Survey, Screen Time Study, Sleep + Performance, or a student-chosen topic.
Continue Your Data and AI Path
After learning to communicate data clearly, students can move into building the pipelines that make data usable for analytics and AI, then continue into machine learning.
Next Course 1
Data Engineering for AI and Analytics
Learn how data is collected, transformed, organized and delivered so analytics and AI systems can use it reliably.
Continue to Data Engineering for AI and Analytics →
Next Course 2
Machine Learning - Data Science Academy
Continue into machine learning and the broader Data Science Academy pathway after developing strong foundations in data interpretation and communication.
Explore the Machine Learning / Data Science Academy →Course Details
CourseData Storytelling with Python
Alternate titleData Storytelling (Visual Thinking)
LevelBeginner
Format100% self-paced, online
Modules4
Units9
Individual capstones4 - one per module
Final capstone1 complete data story
Core Python toolsLists · dictionaries · loops · calculations · text charts
Heavy libraries requiredNo - the core course does not require Pandas or Matplotlib
AI TutorIncluded
CertificateCanadian Institute of Artificial Intelligence (CiAI)
Frequently Asked Questions
Yes. The course focuses on visual thinking, interpretation and communication using simple Python structures such as lists, dictionaries, loops and printed text-based charts rather than heavy data-science libraries.
The current course structure contains 9 units, 4 individual module capstones and 1 separate final capstone.
No. The supplied course materials emphasize Python lists, dictionaries, loops, calculations and text-based charts printed directly in the notebook. The goal is to focus on analytical thinking and communication before adding heavier tools.
Students work with music preferences, screen time, sleep and performance, surveys, frequency tables, comparisons and custom topics. Projects require learners to organize data, calculate summaries, create simple visuals and explain what the results mean.
Students choose a topic, collect real-world data, organize it using Python lists and dictionaries, create a visual chart, calculate summaries such as counts or averages, and communicate 2-3 evidence-based insights in clear language.
A strong insight explains what happened, how important the pattern is, and why it matters. The course also emphasizes careful language such as "suggests" or "appears to be linked" instead of claiming that the data proves causation.
Yes. Students receive guided explanations, hints, debugging support and help understanding Python code, analytical output and data-storytelling concepts.
The certificate of completion is issued by the Canadian Institute of Artificial Intelligence (CiAI).
Continue with Data Engineering for AI and Analytics, followed by the Machine Learning / Data Science Academy.
Meet the Creator of the Course
Learn from an experienced AI and machine-learning scholar who also builds applied technology solutions.

Dr. Mark Lokanan
Professor at Royal Roads University · Senior Machine Learning Engineer at Vedia · Senior Machine Learning & AI Scholar
Dr. Mark Lokanan is a Professor at Royal Roads University and Senior Machine Learning Engineer at Vedia. His work spans machine learning, artificial intelligence, data science, analytics and applied technology. His teaching focuses on making coding, data and AI practical and understandable through structured projects that show learners how individual pieces of code connect into complete systems.