

Currently Empty: USD$0.00
Home » Python 3 » Exploratory Data Analysis in Python
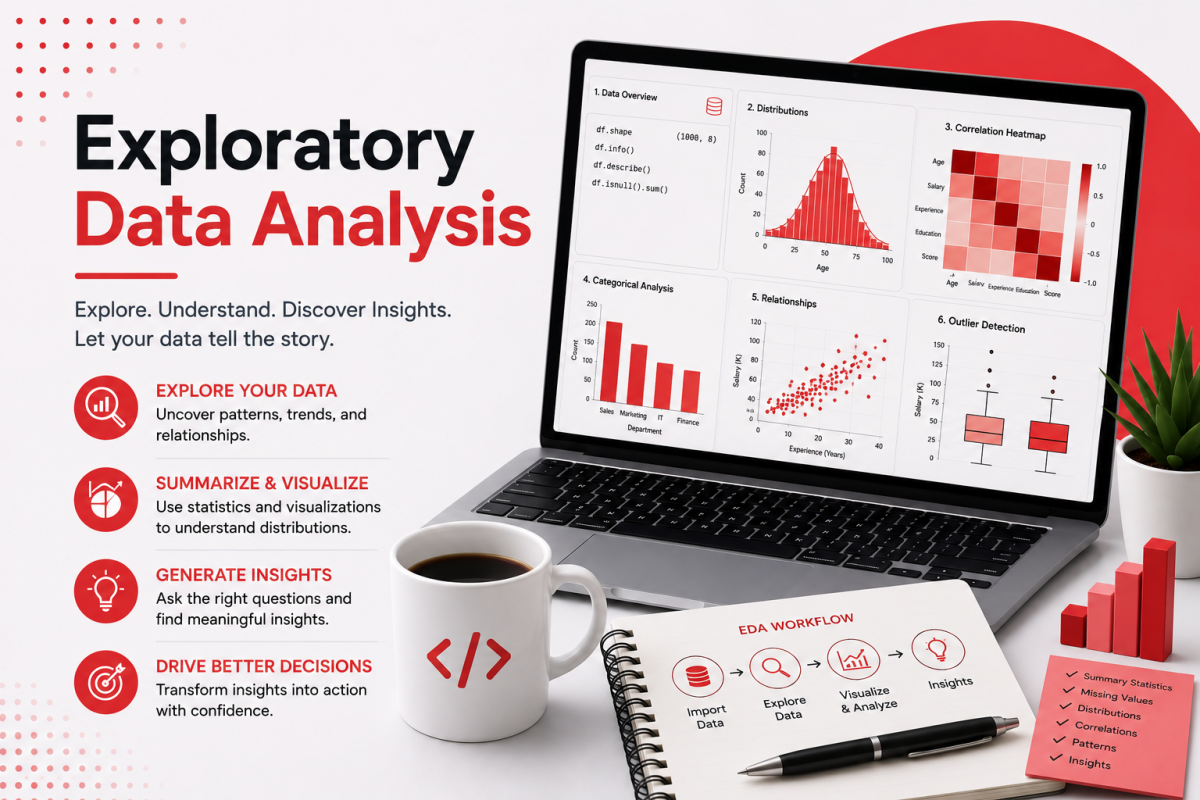
Python 3 · Applied EDA
Exploratory Data Analysis in Python
Learn to investigate data before modelling. Move from first-look analysis through univariate and multivariate EDA, imbalanced data diagnosis and professional reporting.
7 instructional units · 3 individual projects · 2 capstones · Google Colab + interactive capstone · CiAI certificate
Original price was: USD$50.00.USD$15.99Current price is: USD$15.99. /month
Self-paced online access · practical Python analysis · project-based learning
Designed for learners who already know basic Python and Pandas and want to develop professional data-analysis judgement.
EDA Foundations
Understand where EDA fits in the data-science pipeline and how to approach a new dataset systematically.
Statistical + Visual Analysis
Combine descriptive statistics, statistical tests and visualization to understand distributions and relationships.
3 Individual Projects
Practice the course in three focused project blocks before tackling full end-to-end capstones.
2 End-to-End Capstones
Complete one Google Colab capstone and one 15-task interactive DataSoSi capstone with an AI Tutor.
Learn Exploratory Data Analysis as a Professional Workflow
Exploratory Data Analysis is more than producing charts. It is the disciplined process of learning what a dataset contains, identifying quality and distribution issues, measuring relationships, recognizing misleading patterns, and documenting what should happen next before any modelling decision is made.
The workflow taught in this course
Inspect → summarize → visualize → compare → diagnose → communicate → hand off. Learners are taught to interpret every output, not simply run Python commands.
Statistical EDA skills
- Descriptive statistics and categorical summaries
- Skewness and kurtosis
- IQR and Z-score outlier detection
- Pearson, Spearman and point-biserial correlation
- ANOVA and Chi-square testing
- Variance Inflation Factor (VIF)
- Cramér's V for categorical association
Graphical EDA skills
- Histograms and KDE plots
- Box plots, violin plots and QQ plots
- ECDFs and categorical count plots
- Correlation heatmaps
- Scatter and regression plots
- Pair plots and grouped visualizations
- Stakeholder-ready findings and EDA reports
Exploratory Data Analysis in Python — 7 Instructional Units
The curriculum deliberately moves from one-variable analysis to relationships between variables, then into imbalance, categorical-heavy data and professional communication.
Understand the four objectives of EDA, where EDA fits in the data-science pipeline, the first-look workflow, summary statistics, cardinality, outliers, correlations and the core graphical tools used throughout the course.
- EDA mindset and workflow
- Shape, types and missingness
- Summary statistics
- Skewness and kurtosis
- Cardinality and outlier checks
- Correlation and variance checks
Profile individual numeric and categorical variables without charts using descriptive statistics, frequency tables, skewness, kurtosis, cardinality, IQR and Z-score methods.
Choose and interpret the right visualization for a single variable using histograms, KDE plots, box plots, violin plots, QQ plots, ECDFs and count plots.
Measure relationships statistically with Pearson, Spearman and point-biserial correlation, grouped aggregations, ANOVA, VIF, variance checks and Chi-square tests.
Visualize relationships with fixed-scale correlation heatmaps, scatter plots, hue encoding, regression plots, pair plots, violin plots and grouped box plots.
Learn what changes when the target is rare or the dataset is dominated by categorical variables. Quantify imbalance, compare conditional rates, use Cramér's V and explore data by target class.
Turn analysis into a findings log and professional EDA report for both technical and non-technical audiences. Learn the boundary between observing a finding during EDA and acting on it later in the modelling pipeline.
3 Individual Applied EDA Projects
The individual projects break the course into three practice blocks so learners apply the techniques before completing full end-to-end capstones.
Individual Project 1
Profile & Visualize Individual Variables
Apply the Units 1–3 workflow to inspect a dataset, profile numeric and categorical variables, detect distribution issues and choose the right univariate charts.
- First-look workflow
- Descriptive statistics and frequency tables
- Skewness, kurtosis and outlier checks
- Histograms, KDEs, box plots and count plots
Individual Project 2
Measure & Visualize Relationships
Apply Units 4–5 to measure relationships correctly before visualizing them and interpreting what the statistical and graphical evidence says together.
- Correlation and grouped analysis
- ANOVA, VIF and Chi-square
- Heatmaps and scatter plots
- Regression, pair and grouped plots
Individual Project 3
Imbalanced EDA & Professional Reporting
Apply Units 6–7 to examine an imbalanced, categorical-heavy problem and translate findings into a structured technical and stakeholder handoff.
- Class ratios and conditional rates
- Cramér's V and stratified exploration
- Findings log
- Plain-language stakeholder communication
2 Capstones — Two Different Ways to Prove Your EDA Skills
The course finishes with two substantial capstones: one completed independently in Google Colab and one completed inside the DataSoSi interactive project environment.
Capstone 1 · Google Colab Practice
Lifestyle Survey — Complete Independent EDA
Work independently with lifestyle_survey.csv, a fictional Canadian health and finance study. The dataset is deliberately built with skewed variables, an imbalanced target, a near-zero variance feature and genuine correlations so the full EDA toolkit produces meaningful findings.
200 rowsUnseen survey observations
16 columnsNumeric, categorical and ordinal variables
2 targetswellbeing_score + financial_stress
≥15 findingsRequired findings-log entries
- Complete the workflow independently in Google Colab
- Run univariate and multivariate EDA
- Handle an imbalanced binary target correctly
- Create a complete findings log
- Write a six-section professional EDA report
- Produce a plain-language stakeholder summary
Capstone 2 · Interactive DataSoSi Final Capstone
MapleTel Customer Churn — 15-Task EDA Workflow
Analyze a fictional Canadian telecommunications dataset and complete one continuous EDA workflow from objective definition through professional handoff. The interactive environment verifies each task and supports learning without turning the capstone into passive walkthroughs.
1,500 rowsMapleTel customers
12 columnsCustomer, service and churn variables
15 tasksOne continuous end-to-end workflow
AI TutorDebug, hint, explain and verify
- Define the EDA objective and identify
churnas the target - Summarize numerical and categorical variables
- Analyze correlations and group differences
- Diagnose class imbalance and conditional rates
- Build a findings log and translate evidence into plain language
- Use progressive hints, output explanations and solution verification
Python EDA Tools You Will Use
Google ColabCloud notebook capstone
PandasData inspection and analysis
NumPyNumerical operations
MatplotlibCore plotting
SeabornStatistical visualization
SciPyStatistical testing
statsmodelsVIF and diagnostics
Continue Your Python Data Science Path
After Exploratory Data Analysis in Python, move from understanding data to preparing it correctly for machine learning and then building and evaluating models.
Next 1
Data Splitting and Preprocessing
Prepare data for machine learning using train/test splitting and preprocessing workflows while protecting against leakage.
Explore Data Splitting and Preprocessing →Next 2
Building, Evaluating and Interpreting Models
Move from prepared data into model building, performance evaluation and responsible interpretation.
Explore Building, Evaluating and Interpreting Models →Exploratory Data Analysis in Python — Course Details
Format100% self-paced, online
PriceUS$15.99/month
Instructional curriculum7 units
Individual projects3 applied projects
Capstones2 end-to-end capstones
Capstone 1Google Colab · Lifestyle Survey EDA
Capstone 2Interactive · MapleTel Customer Churn
Interactive final capstone15 verified tasks + AI Tutor
Core toolsPython, Pandas, NumPy, Matplotlib, Seaborn, SciPy, statsmodels
CertificateCanadian Institute of Artificial Intelligence (CiAI)
Frequently Asked Questions
Exploratory Data Analysis is the structured process of investigating a dataset before modelling. You inspect its structure, describe variables, visualize distributions, measure relationships, identify imbalance and quality issues, and document what the modelling team should consider next.
The course includes 3 individual applied projects and 2 capstones.
The Google Colab capstone uses lifestyle_survey.csv, a 200-row, 16-column dataset. Learners complete the full EDA workflow independently, build a findings log with at least 15 entries, and write a six-section professional report.
The interactive final capstone analyzes 1,500 MapleTel customers across 12 variables. Learners complete 15 tasks covering objective definition, univariate and multivariate EDA, visualization, imbalance diagnosis, categorical analysis and professional reporting. The environment includes verification, progressive hints, code and output explanations, and an embedded AI Tutor.
Yes. The course combines graphical EDA with statistical techniques including correlation, ANOVA, Chi-square, VIF, Cramér's V, skewness, kurtosis and outlier diagnostics.
Continue with Data Splitting and Preprocessing, followed by Building, Evaluating and Interpreting Models.
The course is created by Dr. Mark Lokanan, Professor at Royal Roads University, Senior Machine Learning Engineer at Vedia, and senior machine-learning and AI scholar.
Meet the Creator of the Course
Learn from a senior scholar and practitioner working across machine learning, AI, analytics and applied decision problems.

Dr. Mark Lokanan
Professor · Senior Machine Learning Engineer at Vedia · Senior Machine Learning & AI Scholar
Dr. Mark Lokanan is a Professor at Royal Roads University, a Senior Machine Learning Engineer at Vedia, and a senior machine-learning and AI scholar. His work applies machine learning, deep learning and artificial intelligence to fraud, financial crime, analytics and complex real-world decision problems. His teaching focuses on making Python, data science and AI practical and accessible to professionals and adult learners.
Exploratory Data Analysis Assistant
Ask me about the 7 units, 3 individual projects, 2 capstones, Google Colab, MapleTel capstone, certificate, or next courses.