Currently Empty: USD$0.00
⭐ Featured
Python for Data Visualization
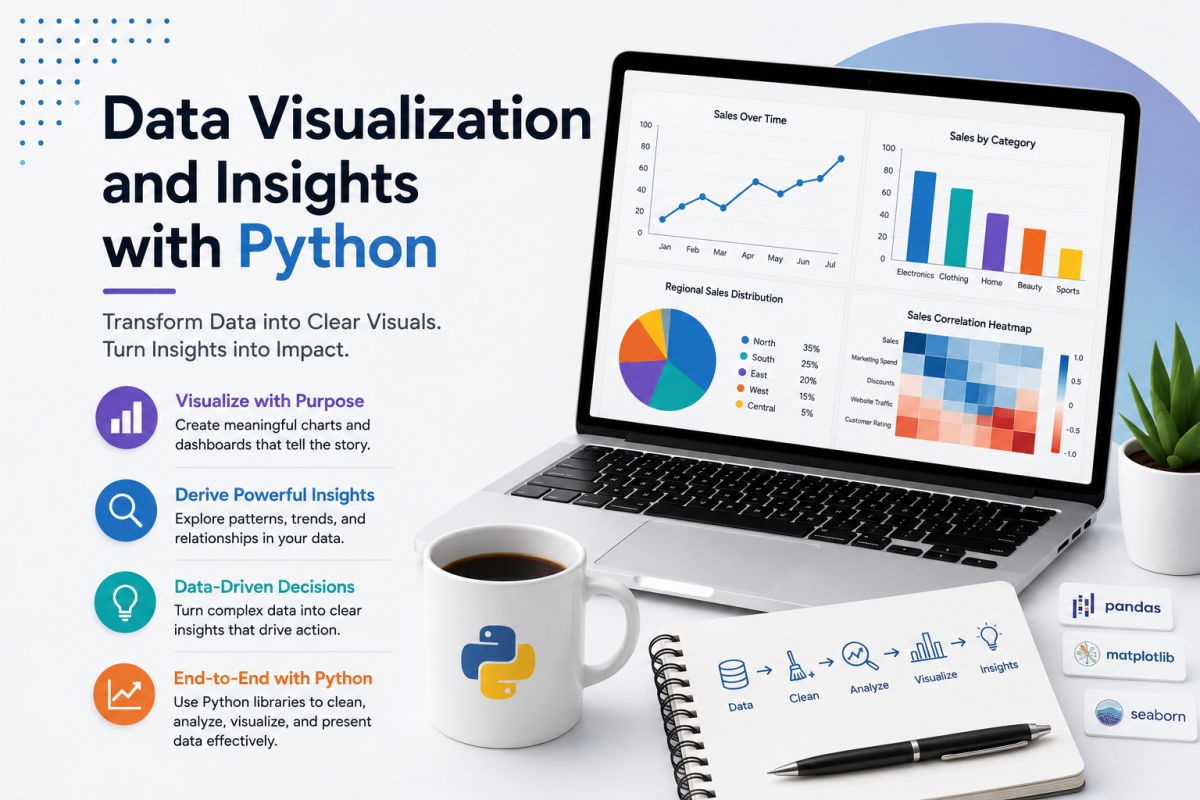
Turn Python data into clear, useful visual insights through hands-on project work.
8 individual projects · 1 final capstone · project-based learning · AI Tutor · CiAI certificate.
Original price was: USD$50.00.USD$15.99Current price is: USD$15.99. /month
Self-paced online · Practical Python visualization for adult learners and working professionals.
Learn by Visualizing Data
Develop Python visualization skills through practical, hands-on work rather than passive demonstrations.
8 Individual Projects
Complete eight separate projects that progressively strengthen your ability to create and interpret data visualizations.
One Final Capstone
Bring the course skills together in a final capstone focused on communicating insights visually.
Communicate Insights Clearly
Move beyond creating charts by learning to use visual output to support interpretation and decision-making.
Build Practical Python Data Visualization Skills
Python for Data Visualization is a project-based course for learners who want to use Python to turn data into visual information that is easier to explore, interpret and communicate.
From data to visual insight
The course emphasizes practice. Learners complete eight individual visualization projects and then apply the course skills in one final capstone.
What you will develop
- Confidence using Python for data visualization
- Ability to choose useful visual approaches for data
- Practice creating and refining visual output
- Ability to interpret patterns shown in charts
- Stronger visual communication of analytical findings
- A repeatable workflow from data to visual insight
Who this course is for
- Professionals who want practical Python visualization skills
- Learners moving into data and analytics work
- Non-technical and social-science professionals building coding confidence
- Python learners who want more hands-on visualization practice
Python for Data Visualization: 8 Individual Projects
The course contains eight individual hands-on projects. Each project gives learners another opportunity to practice building, interpreting and communicating with Python visualizations.
Hands-on Python data visualization practice that contributes to the skills used in the final capstone.
Hands-on Python data visualization practice that contributes to the skills used in the final capstone.
Hands-on Python data visualization practice that contributes to the skills used in the final capstone.
Hands-on Python data visualization practice that contributes to the skills used in the final capstone.
Hands-on Python data visualization practice that contributes to the skills used in the final capstone.
Hands-on Python data visualization practice that contributes to the skills used in the final capstone.
Hands-on Python data visualization practice that contributes to the skills used in the final capstone.
Hands-on Python data visualization practice that contributes to the skills used in the final capstone.
Final Comprehensive SQL Capstone
After the six unit capstones, students complete one final capstone that tests whether they can combine SQL skills rather than use commands in isolation.
Part 1 · FoundationsSELECT, WHERE, ORDER BY, LIMIT and aggregate functions.
→
Part 2 · Business Query EssentialsGROUP BY, HAVING, DISTINCT, calculations and combined business queries.
→
Part 3 · Joins & SubqueriesINNER/LEFT joins, multi-table joins, aggregation with joins and basic subqueries.
Comprehensive Assessment
Test the complete SQL practice journey
The final capstone requires learners to decide which SQL techniques fit the business problem, connect tables where needed, calculate useful metrics and interpret the resulting output.
8 Individual Projects + 1 Final Capstone
Complete eight individual projects throughout the course, then finish with one final capstone that brings the visualization workflow together.
9Final Capstone
Python Data Visualization Capstone
Apply the visualization skills developed across the eight individual projects in one integrated final project focused on turning data into clear visual insight.
- Integrate skills from the course
- Create and interpret visual output
- Communicate findings clearly
Continue Your Python Learning Path
After Python for Data Visualization, continue strengthening your Python data skills.
Next
Data Analysis in Python
Develop practical Python skills for cleaning, exploring, analyzing and interpreting data.
Explore Data Analysis in Python →Next
Data Cleaning and Wrangling
Build stronger skills for preparing messy data for analysis.
Explore Data Cleaning and Wrangling →Related
Python AI Prompting
Strengthen your ability to use structured AI prompting when working with Python code.
Explore Python AI Prompting →Python for Data Visualization Course Details
Format100% self-paced, online
Individual Projects8
Final Capstone1
Total Project Work9 hands-on projects
FocusPython data visualization and visual communication
AI TutorIncluded — course-specific guidance
CertificateIssued by the Canadian Institute of Artificial Intelligence (CiAI)
Frequently Asked Questions
It is a project-based Python course focused on developing practical data visualization and visual communication skills.
There are exactly 8 individual projects plus 1 final capstone, for 9 hands-on projects in total.
Yes. The course is structured around eight individual projects followed by a final capstone.
The final capstone brings together the visualization skills developed across the eight individual projects in one integrated project.
It is designed for Python learners, professionals, career changers and non-technical learners who want practical data visualization skills.
Yes. The embedded AI Tutor provides course-specific guidance and learning support.
The certificate of completion is issued by the Canadian Institute of Artificial Intelligence (CiAI).
You can continue with Data Analysis in Python or Data Cleaning and Wrangling.
Visit the DataSoSi FAQs or Contact Us.
Meet the Creator of the Course
Learn from an educator and machine learning engineer working across analytics, AI, data science and applied business problems.

Dr. Mark Lokanan
Professor · Senior Machine Learning Engineer · Data Scientist · AI Specialist
Dr. Mark Lokanan is a professor at Royal Roads University and a Senior Machine Learning Engineer at Vedia. His work brings together data science, machine learning, artificial intelligence, analytics, financial crime, and applied research. He has extensive experience using data and analytical methods to examine complex real-world problems and translate technical findings into practical decisions. His teaching focuses on making data, coding, and AI accessible to professionals and adult learners, particularly those who do not come from traditional computer science or engineering backgrounds. Through his academic and industry work, he develops practical approaches that connect technical skills with workplace applications, decision-making, and emerging uses of AI and machine learning.
Python for Data Visualization Assistant
Ask me about the 8 individual projects, final capstone, course focus, certificate, or what to take next.